












Video Marketing on Social Media Statistics 2016 · 415 respondents
Video Marketing on Social Media Statistics 2016
These statistics were gathered by surveying 415 unique respondents, from both paid and organic sources. We targeted UK and USA audiences, however didn’t make this a requirement to complete the survey. We didn’t specify further criteria for entry to the survey. We did this so that we achieved a broad demographic spectrum. We asked an initial question to understand who had watched a branded video on social media. If people answered “No” this filtered them out from the rest of the survey as they are not applicable.
55%
of social media users have watched branded video ads
Wyzowl Video Marketing on Social Media Statistics 2016 n = 415Link
- Respondents
- 415
- Year
- 2016
- Audience
- Social media users
- Targeted
- UK and USA
Survey: Video Marketing on Social Media
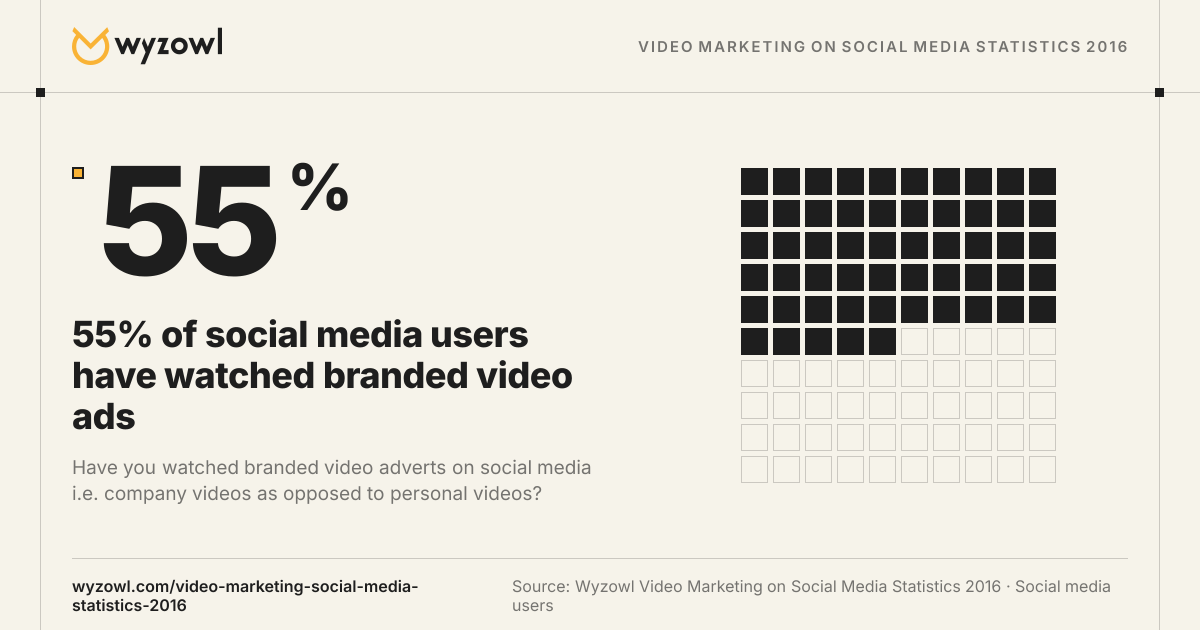
55% of social media users have watched branded video ads
“Have you watched branded video adverts on social media i.e. company videos as opposed to personal videos?”
55%
We found that video ads are consumed in great volume by social media users. More than half of users (55%) say they’ve spent time on social media watching branded video ads.
Share and download
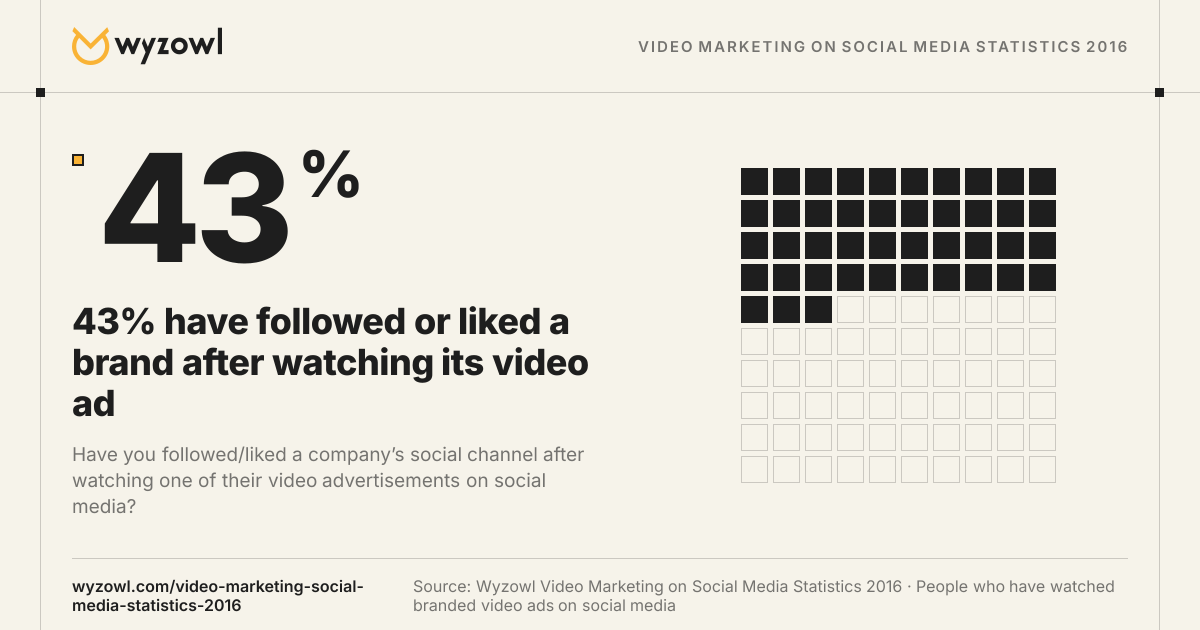
43% have followed or liked a brand after watching its video ad
“Have you followed/liked a company’s social channel after watching one of their video advertisements on social media?”
43%
We found that brands use videos to help build their social audience. 43% of users say that, having watched an ad, they’ve gone on to like or follow that brand.
Share and download
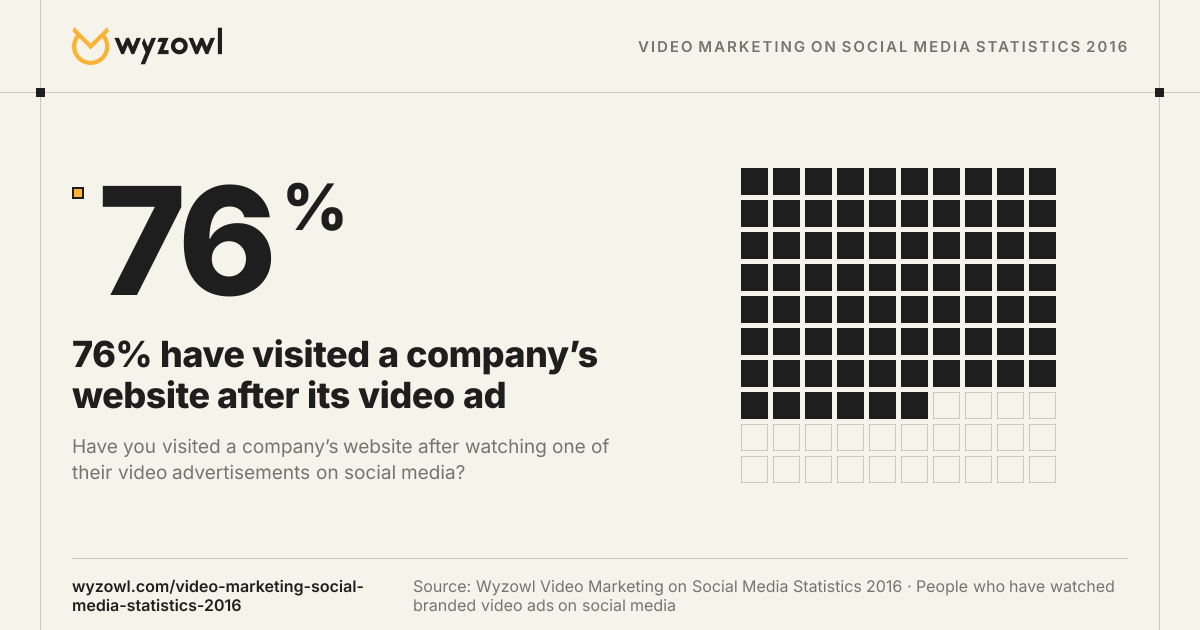
76% have visited a company’s website after its video ad
“Have you visited a company’s website after watching one of their video advertisements on social media?”
76%
We found that video ads drive web traffic. More than three-quarters (76%) of users have visited a company’s website after watching one of their video ads on social media.
Share and download
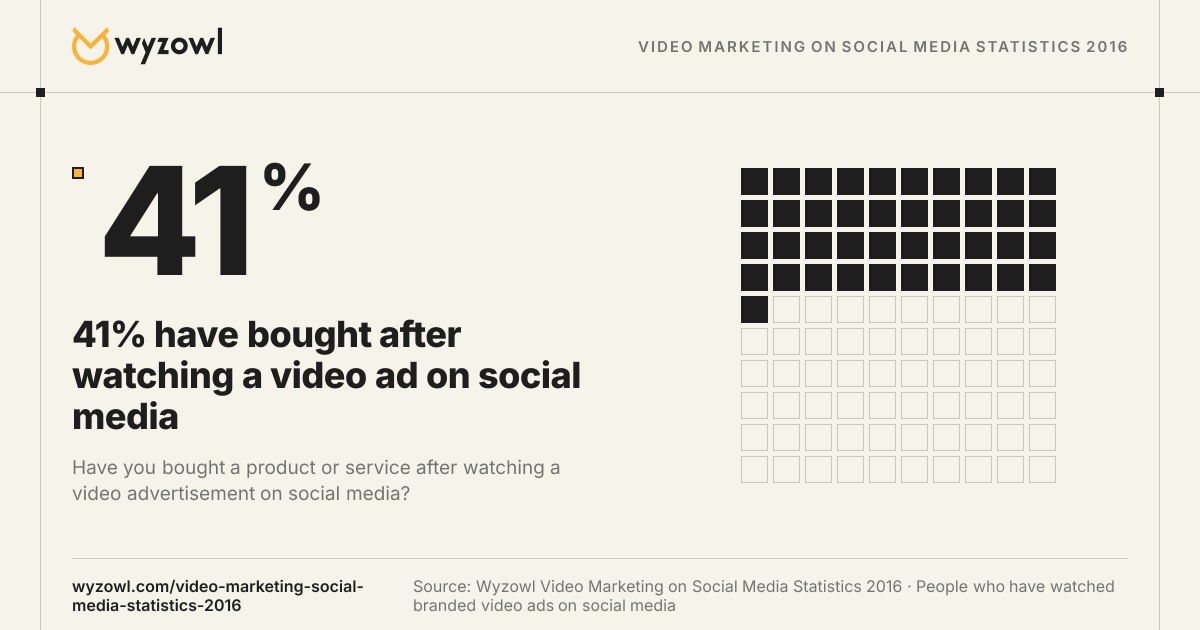
41% have bought after watching a video ad on social media
“Have you bought a product or service after watching a video advertisement on social media?”
41%
We found that social media video ads drive sales. More than 4 in 10 social users (41%) say they’ve bought a product or service after watching a video ad on social media.
Share and download
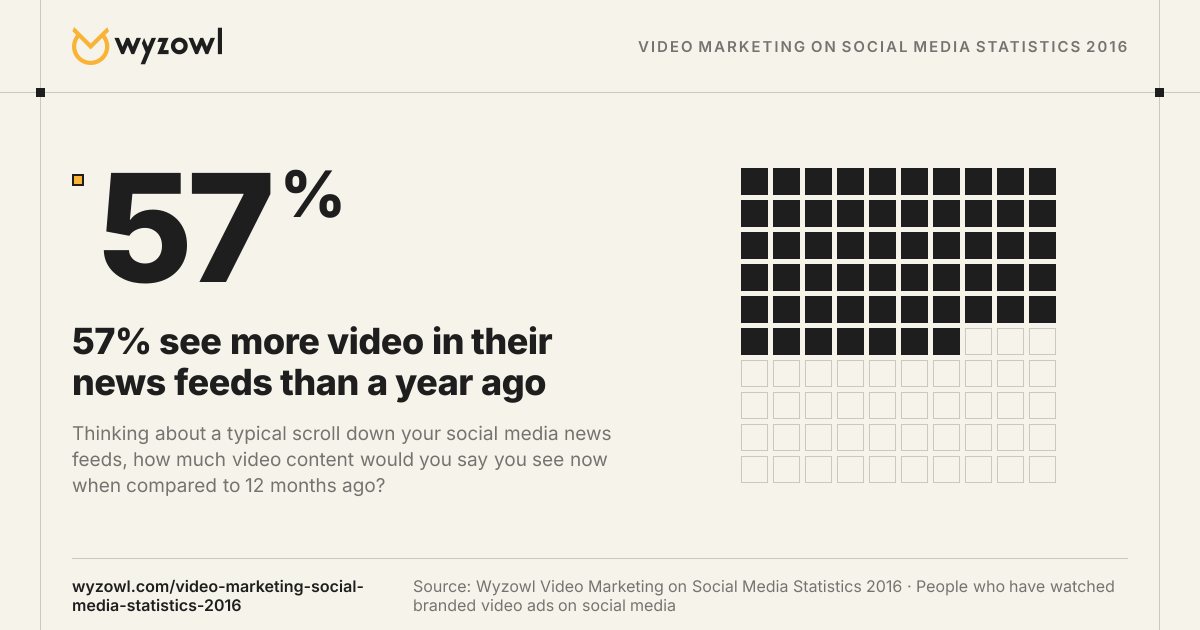
57% see more video in their news feeds than a year ago
“Thinking about a typical scroll down your social media news feeds, how much video content would you say you see now when compared to 12 months ago?”
57%
We found that video is becoming more prominent on social media. More than 57% of users report seeing more video content on their social media news feeds than they did 12 months ago.
Share and download
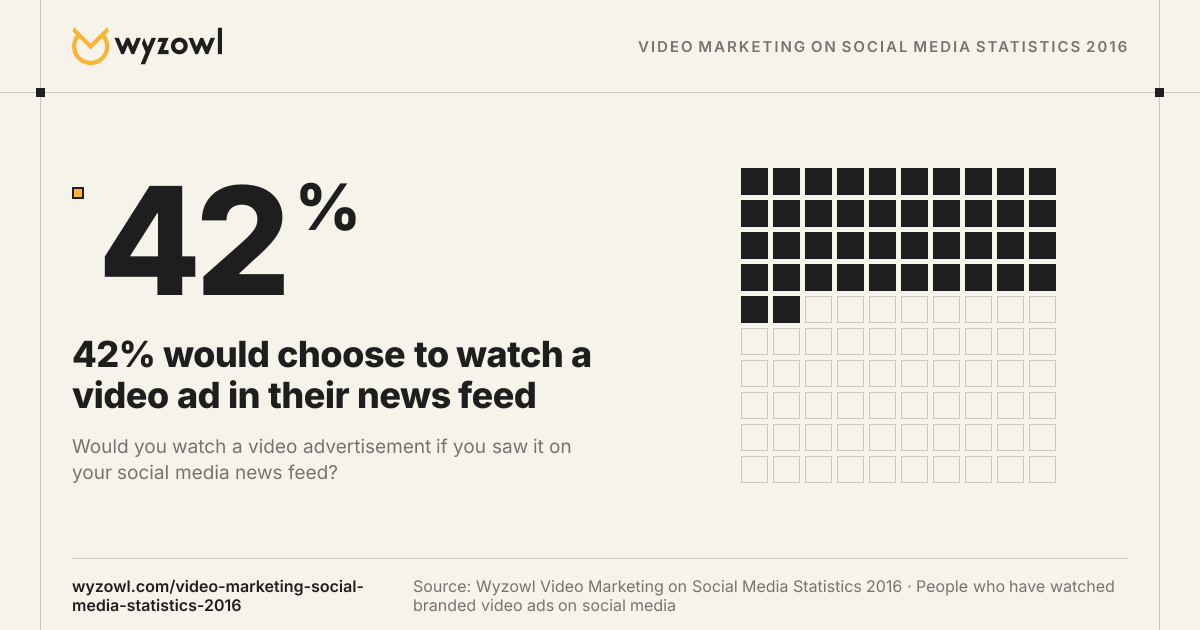
42% would choose to watch a video ad in their news feed
“Would you watch a video advertisement if you saw it on your social media news feed?”
42%
We found that a large portion of users will actively choose to watch a video ad. 42% of users would actively choose to watch an ad they saw on their news feed.
Share and download
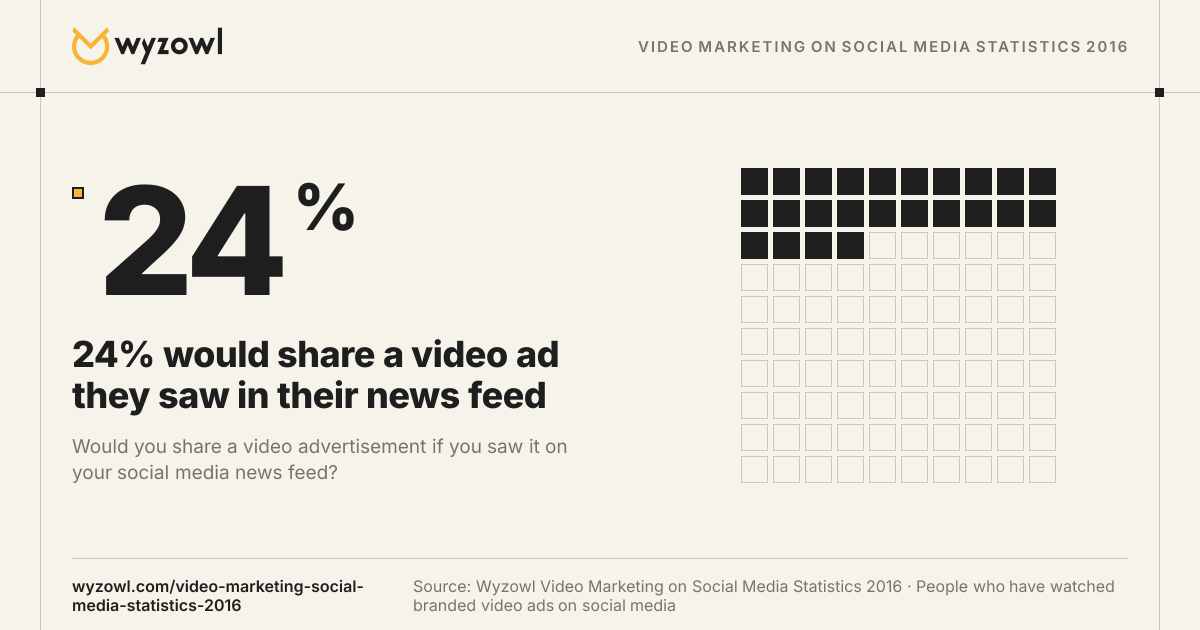
“Would you share a video advertisement if you saw it on your social media news feed?”
24%
Share and download
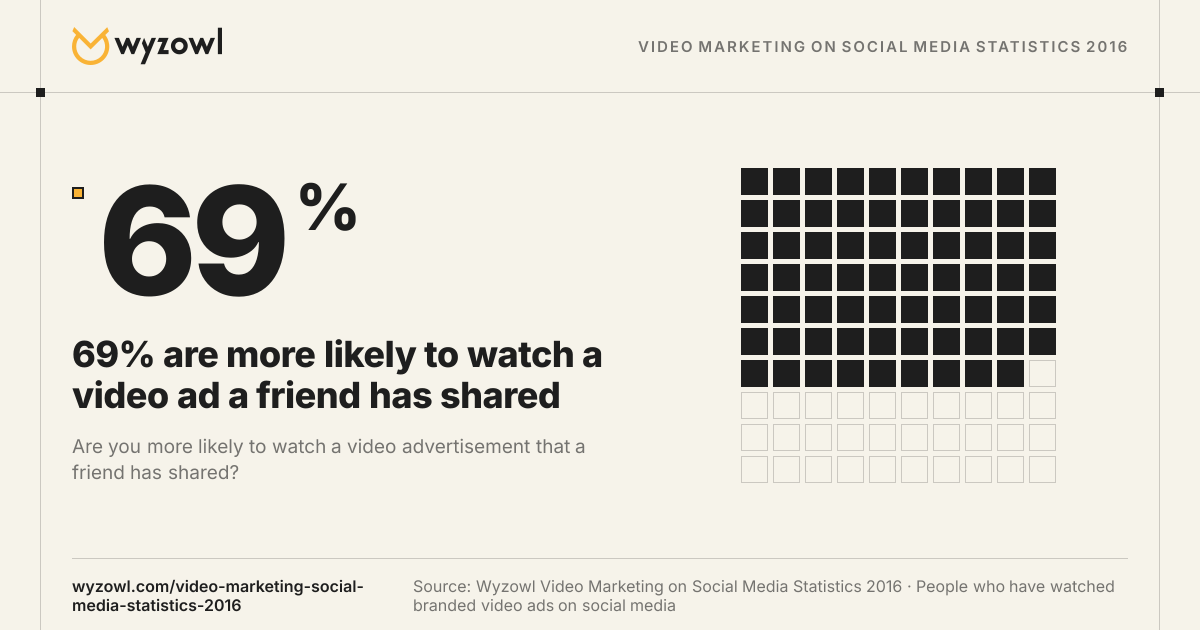
“Are you more likely to watch a video advertisement that a friend has shared?”
69%
Share and download
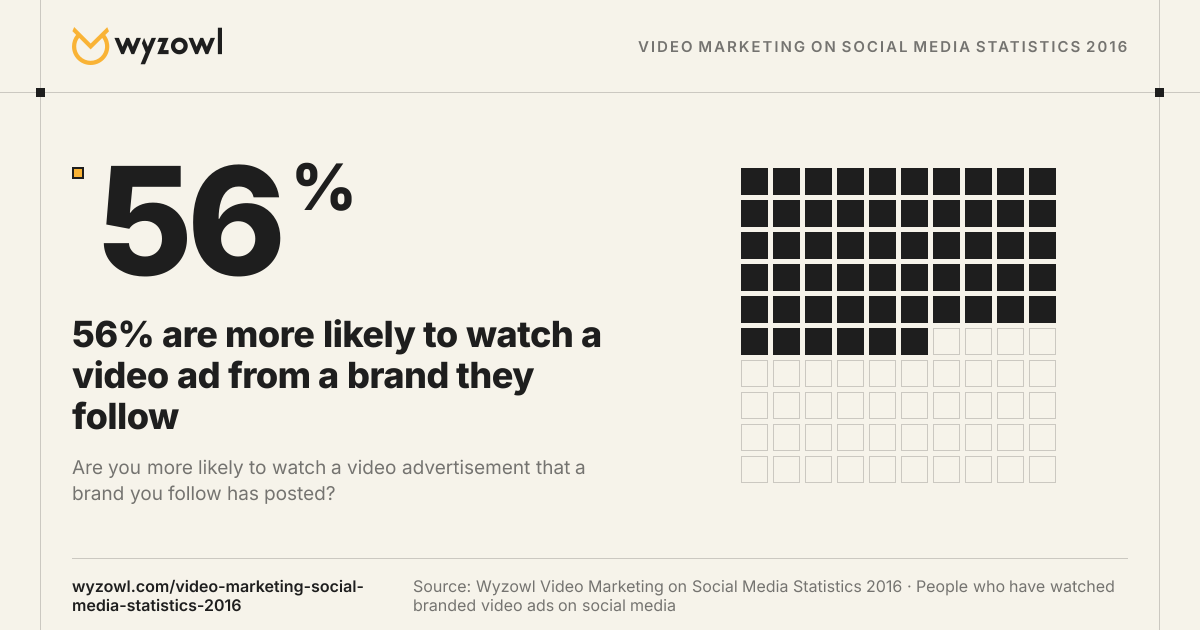
56% are more likely to watch a video ad from a brand they follow
“Are you more likely to watch a video advertisement that a brand you follow has posted?”
56%
Users are more likely to watch video ads posted by their favourite brands. Over half (56%) say they’d be more likely to watch an ad posted by a brand they already follow or like.
Share and download
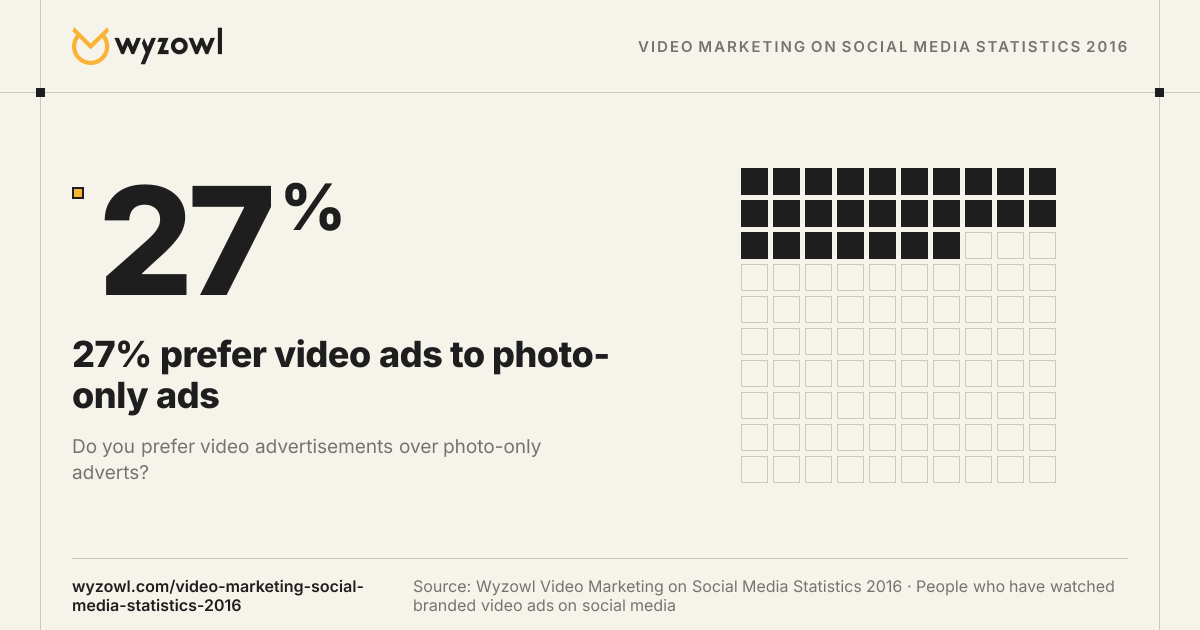
27% prefer video ads to photo-only ads
“Do you prefer video advertisements over photo-only adverts?”
27%
Users value the immediacy of photo-only adverts… Only just over a quarter of users (27%) say they prefer video ads to photo-only.
Share and download
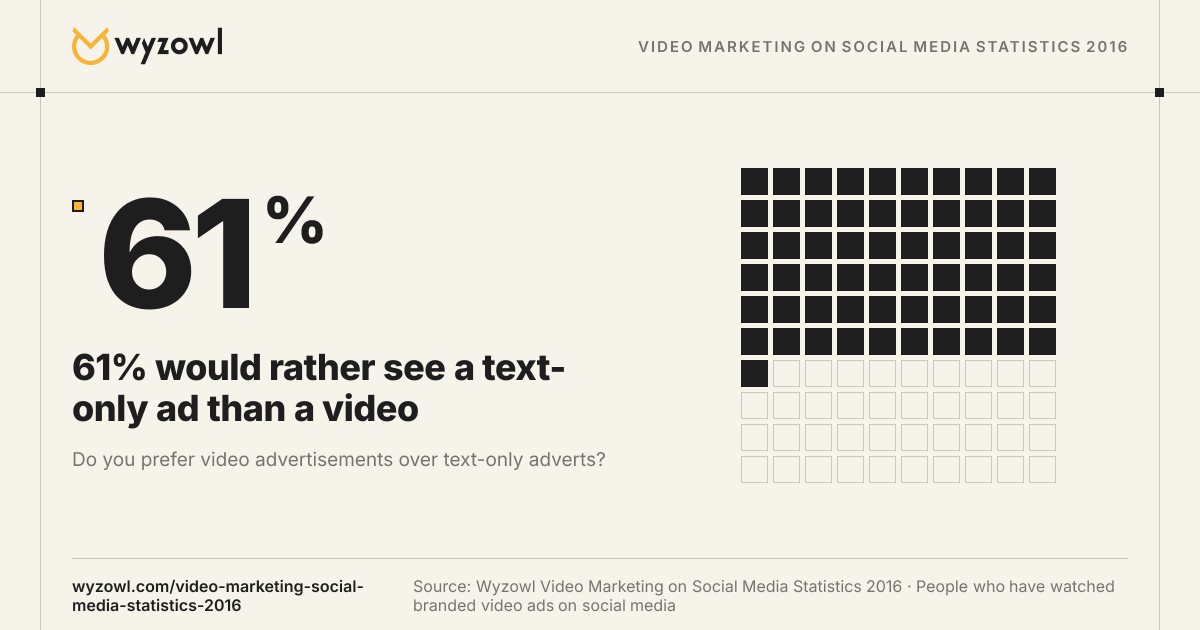
61% would rather see a text-only ad than a video
“Do you prefer video advertisements over text-only adverts?”
61%
People like the simplicity of text-only adverts… 61% say they’d rather see a text-only advert than a video.
Share and download
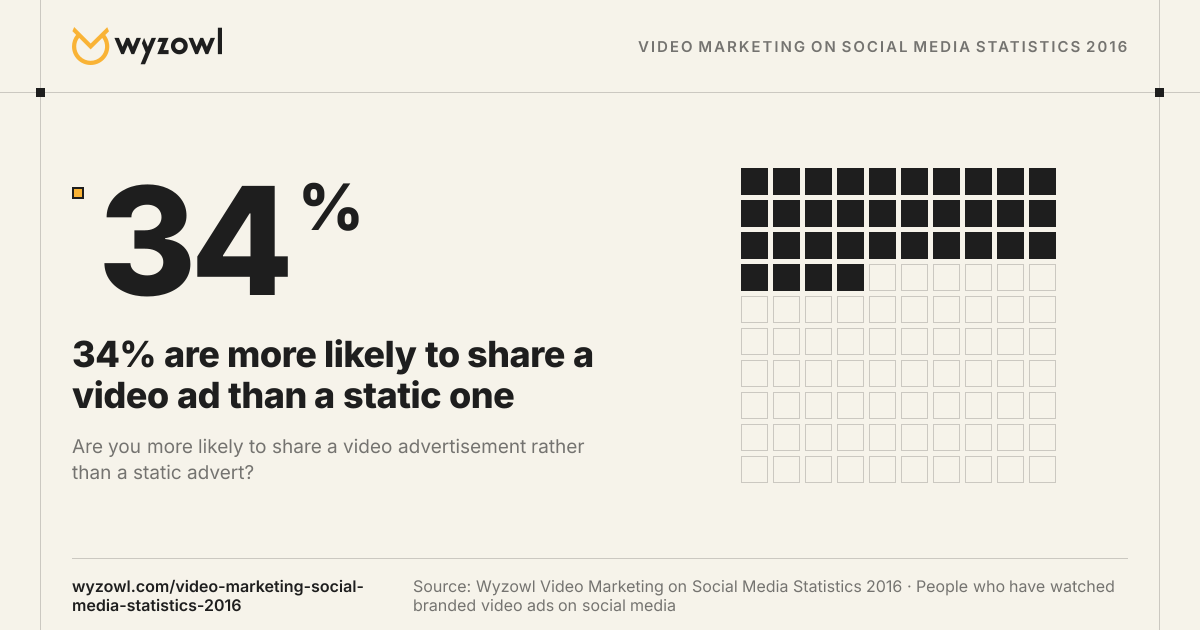
“Are you more likely to share a video advertisement rather than a static advert?”
34%
Share and download
Methodology and citation
These statistics were gathered by surveying 415 unique respondents, from both paid and organic sources. We targeted UK and USA audiences, however didn’t make this a requirement to complete the survey. We didn’t specify further criteria for entry to the survey. We did this so that we achieved a broad demographic spectrum. We asked an initial question to understand who had watched a branded video on social media. If people answered “No” this filtered them out from the rest of the survey as they are not applicable.
Every figure on this page is also available as a spreadsheet: one row per question, with who was asked and a link to its chart.
Each finding and chart has its own link and citation, so you can point readers to the exact figure.
Simple fixed pricing.
No hidden fees. Ever.